Ever felt like you’re flying blind on LinkedIn? You have been creating amazing content and connecting with tons of people, but have no clue if it’s actually paying off. Welcome to LinkedIn Analytics, which tells you what’s working and what’s not.
When you know how to check LinkedIn Analytics, you can use the results to refine your LinkedIn marketing strategy, target the right audience, and ultimately achieve your goals, whether it’s generating leads, building brand awareness, or attracting top talent.
- What Are LinkedIn Analytics?
- Where to Find LinkedIn Analytics?
- How to Use LinkedIn Analytics
- Important LinkedIn Analytics Metrics to Track
- Visitor Metrics
- Follower Metrics
- Engagement Metrics
- How to Create LinkedIn Analytics Reports on LinkedIn
- How to Create a LinkedIn Analytics Report in Dripify
- LinkedIn Analytics Tips
- 1. Understand Your Audience
- 2. Decode Your Audience’s Behavior
- 3. Content is King (But Not All Content is Created Equal)
- 4. Identify Trends and Adapt Your Content
- How to Grow Your Network on LinkedIn with Dripify
This guide covers everything about the LinkedIn analytics tool, including what metrics to track and how to track them.
What Are LinkedIn Analytics?
LinkedIn analytics is a collection of data and insights that reveal how your target audience is responding to your company page, content, and even the posts you publish on your profile. The metrics let you gauge the effectiveness of your LinkedIn strategy and whether you need to tweak your approach.
Where to Find LinkedIn Analytics?
How to check LinkedIn analytics? Here’s your step-by-step guide to accessing your LinkedIn Company Page analytics:
- Log in to your LinkedIn account and head over to your company page;
- On your company page, click on Admins View;
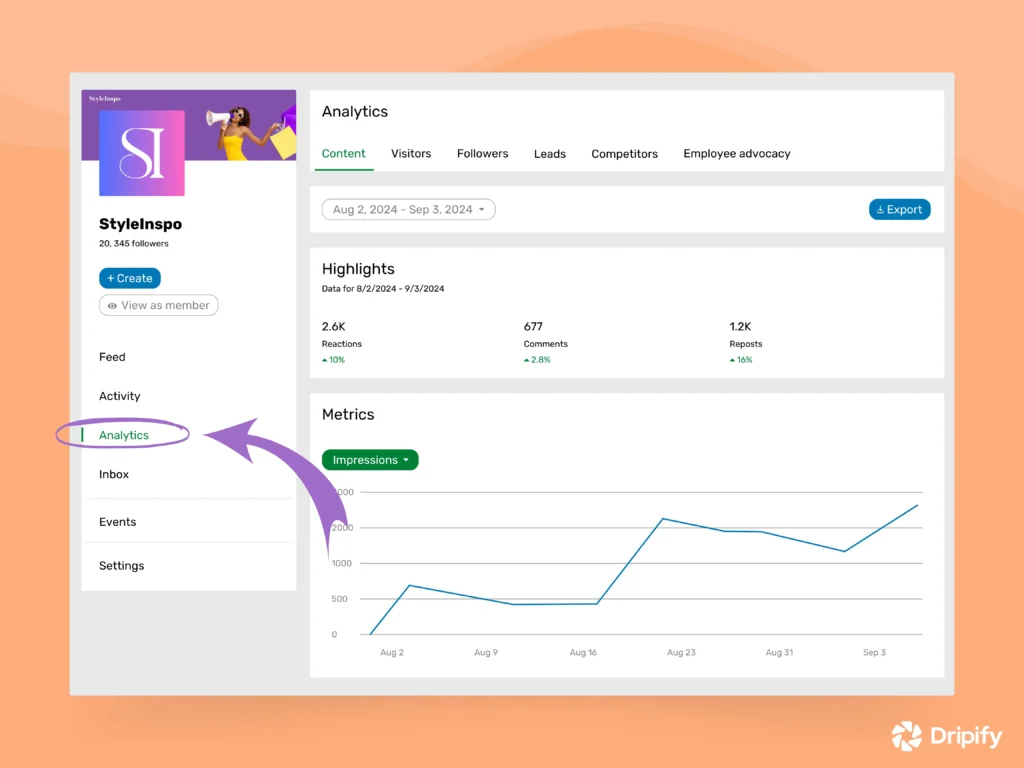
- Next, choose “Analytics” from your screen’s left side. (Note: Only page admins or those with “analyst” access can view these metrics);
- Now, you’ll be greeted by a dashboard presenting valuable information. You’ll see neatly organized sections like Followers, Content, Visitors, and more, making it easy to access the information you need;
- On the right side of your dashboard, you’ll find a quick snapshot of your performance over the past 30 days. This is a handy way to get a high-level view of your company page’s activity.
Remember, the more you explore these analytics, the better you’ll understand what’s working on your LinkedIn page and what improvements your page needs.
Wondering how you can access analytics for posts you published on your LinkedIn profile instead of the company page?
Here are the steps:
- Log in to your LinkedIn account;
- Click the “Me” icon in the top right corner;
- Select “Posts & Activity” from the dropdown menu;
- LinkedIn will show you the posts published;
- Each post has a View Analytics button below it. Simply click on it and get the engagement data for your post.

How to Use LinkedIn Analytics
LinkedIn analytics are great, but only if you know how to interpret and use them effectively.
Here’s how to use LinkedIn analytics to your advantage:
- Set SMART Goals: Before even accessing the analytics, define your SMART goals for LinkedIn. Do you want to generate leads, build brand awareness, or recruit top talent on the platform? This way, you’ll identify the most relevant LinkedIn analytics metrics to track;
- Track Metrics: Remember, not all metrics are created equal. As such, try to focus on metrics that directly align with your B2B goals. For example, if lead generation on LinkedIn is your priority, you’ll want to track metrics like website clicks and form submissions;
- Analyze Trends: Isolated data points can be misleading. Instead, track metrics over time to identify trends. Are your impressions increasing? Is your content engagement growing? Observing trends helps you understand the impact of your efforts and make informed decisions;
- Benchmark Yourself: Compare your performance against industry benchmarks or competitors. This way, you’ll gain a sense of how you’re stacking up and identify areas where you can improve.
Important LinkedIn Analytics Metrics to Track
Now, let’s check out the most important LinkedIn analytics metrics that you should track for your business success:
Visitor Metrics
LinkedIn visitor analytics offer a glimpse into the people browsing your company page. These individuals aren’t necessarily followers or customers yet, but they’ve shown some curiosity about your brand on LinkedIn.
You can use this data to understand the interests of your company page visitors and tailor your approach or content to convert them into loyal fans.
- Unique Visitors: This metric reveals the actual number of people checking out your company page. You can track this to gauge overall interest in your brand on LinkedIn;
- Visitor Demographics: Dive deeper and see who’s visiting your page. Filter by location, industry, job title, and more to understand your audience and tailor your content accordingly.
Follower Metrics
As you know, followers are the heart of any thriving LinkedIn community. They’ve actively chosen to connect with your company page and content.
This means understanding their demographics (location, industry, etc.) can help you tailor content that resonates, fostering deeper engagement and strengthening your brand’s presence on the platform.
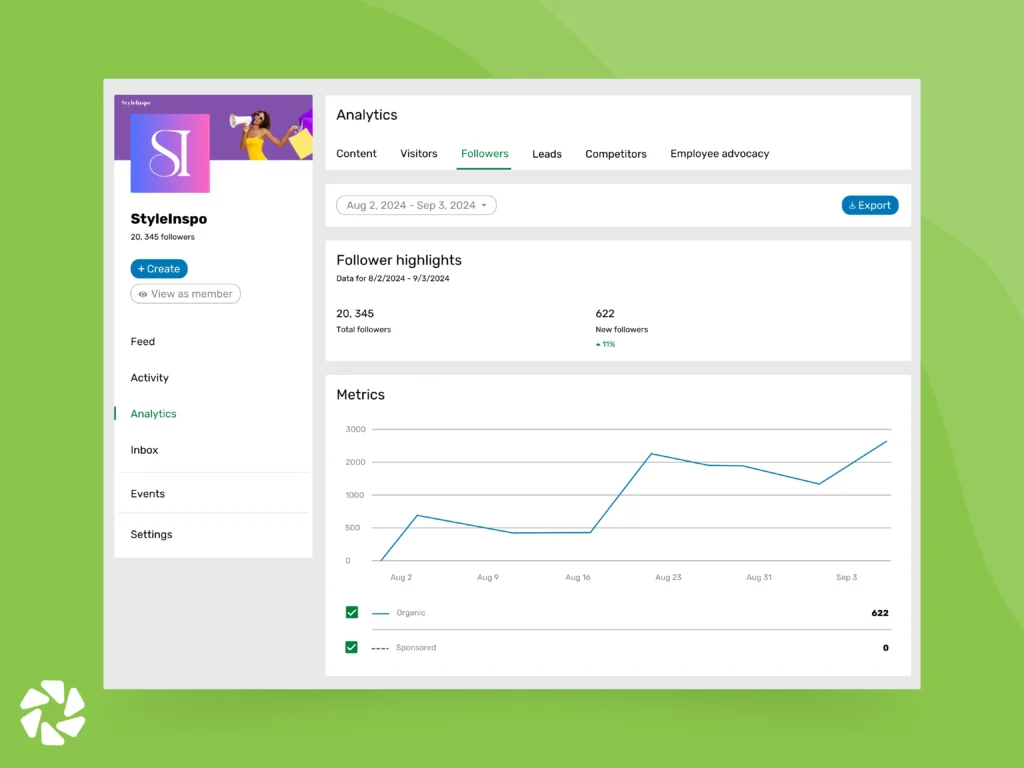
- Total Followers: Track your overall follower growth to measure brand awareness and popularity;
- Organic Followers: Identify followers genuinely interested in your brand or content who found you organically;
- Follower Demographics: Analyze follower demographics to understand who your audience is. Use these insights to create targeted content that resonates with them;
- Follower Trends: This metric reveals the number of new followers you gain over time, allowing you to see if your audience is steadily growing or if there’s been a shift.
Engagement Metrics
LinkedIn engagement rate metrics reveal how your target audience interacts with your content. Metrics such as reactions, comments, and shares let you know what resonates with your audience. You can use these insights to refine your content strategy and create posts that truly spark conversation and connection.
- Impressions: See how many times your content appeared in LinkedIn feeds;
- Engagement Rate: This metric combines reactions, comments, shares, and follows into a single percentage, revealing how well your content is engaging your audience;
- Clicks: Track clicks to understand if your content is prompting users to visit your website or learn more;
- Shares: A high number of shares indicates your content is valuable and resonates with your audience, boosting reach and brand awareness;
- Comments: Analyze comments to gauge content effectiveness and identify topics that spark conversation within your target audience.

Other LinkedIn performance metrics you might want to track include the following:
- Volume of Mentions: See how your brand resonates with your professional network. A high volume of mentions indicates strong brand awareness and positive engagement;
- Employee Advocacy: Check out how many employees actively participate in your program by tracking the number of recommendations they give and posts they share. Monitor reactions, comments, and reposts of employee-shared content;
- Video Views: This metric tracks the total number of times users have viewed your videos, regardless of whether they watched the entire video or just a few seconds.
Remember not to get bogged down by all of the LinkedIn analytics terms and metrics. Instead, focus on the ones that align with your LinkedIn goals and use them to refine your strategy for maximum impact.
How to Create LinkedIn Analytics Reports on LinkedIn
While the built-in LinkedIn analytics dashboard provides a good starting point, you may want to create more comprehensive reports for deeper analysis.
LinkedIn allows you to export your LinkedIn analytics report data into an XLS file. You can then import this data into your favorite spreadsheet software to create custom reports tailored to your specific needs.
Here’s how to export your LinkedIn analytics tool data for report creation:
- Head over to your company page and ensure you’re logged in with an admin account;
- Click on the “Analytics” dropdown menu within your admin view;
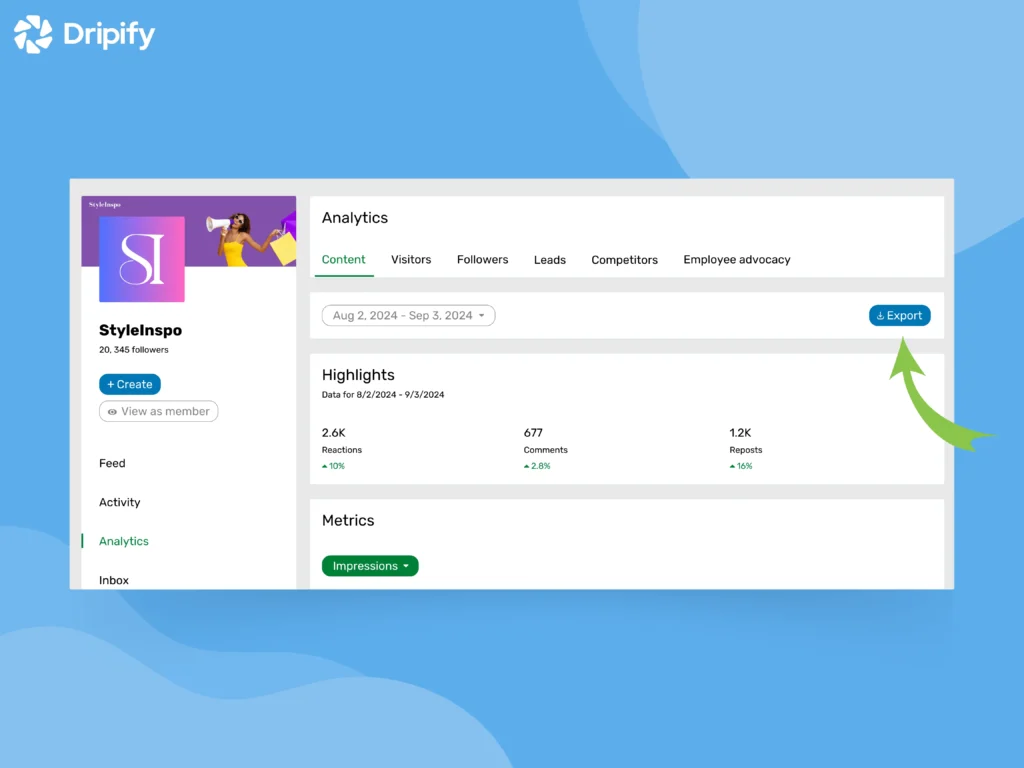
- Select the specific area you want to analyze – visitors, content, followers, competitors, leads, or employee advocacy;
- Click the “Export” button located in the upper right corner;
- Choose the date range for the data you want to export;
- Click “Export” again, and your data will be downloaded as an XLS file (Excel spreadsheet).
Now you can use the XLS file to create customized reports.
Bonus Tip: For those comfortable with developer tools, LinkedIn also offers an API program allowing access to your page data through code.
How to Create a LinkedIn Analytics Report in Dripify

Dripify, one of the best LinkedIn analytics tools available on the market that can simplify the process of collecting, analyzing, and reporting on your LinkedIn data.
Dripify is an advanced LinkedIn analytics tool available that offers pre-built reports with visualizations, allowing you to easily track key metrics, identify trends, and gain deeper insights into your LinkedIn performance.
Here’s how:
- Daily Stats at a Glance: No more wondering what you accomplished yesterday. Dripify tracks your daily LinkedIn actions, showing you connection requests, unread messages, and profile views – all in one convenient dashboard;
- Recent Activity Timeline: Ever feel like you’re missing something? Review a detailed timeline of your recent LinkedIn activity managed by Dripify. You’ll have complete control and stay on top of every interaction;
- Campaign Performance Tracker: Evaluate your Dripify campaigns with in-depth reports. Track crucial metrics like invitation acceptance and response rates, all conveniently compared to previous periods. See what’s working and optimize your strategy for even better results;
- Lead Data at Your Fingertips: Need to export lead information for further outreach? Dripify LinkedIn automation tool lets you download lead data, including email addresses, phone numbers, and company details, as a CSV file for seamless integration with your CRM or email marketing tools.
LinkedIn Analytics Tips
Now, let’s go over some essential tips on how to use LinkedIn analytics effectively:
1. Understand Your Audience
Analyze visitor and follower demographics to understand your audience’s location, industry, and seniority level.
Are they young professionals just starting out, or seasoned veterans leading the pack? Then, the findings will be used to create targeted content that resonates with their specific needs and interests.
Also, compare visitor demographics with your follower base. This ensures your content aligns with the audience you’re trying to attract, maximizing the impact of your LinkedIn outreach.
2. Decode Your Audience’s Behavior
Go beyond basic post views and instead check out how your audience interacts with your content and industry trends.
What sparks their engagement? Do they engage more with insightful articles, thought-provoking questions, or interactive polls? Use the insights to set realistic goals, schedule posts strategically, and craft content that truly resonates.
3. Content is King (But Not All Content is Created Equal)
Different content formats can ignite engagement for various reasons. Consider your audience’s preferences, the nature of your business, and even the ever-evolving LinkedIn algorithm. Track your post performance meticulously to identify content types that generate the most engagement, traffic, and overall results.
Perhaps your audience loves in-depth videos that spark discussion in the comments section. Maybe they’re more receptive to interactive polls that allow them to voice their opinions.
Experiment with diverse content formats and leverage analytics to understand what truly resonates with your audience. Once you discover winning strategies, replicate them to amplify your brand voice and cultivate a loyal following.
4. Identify Trends and Adapt Your Content
See which posts are generating the most buzz and identify trending topics that pique your audience’s interest. Explore popular LinkedIn hashtags to gain a deeper understanding of current industry conversations.
In doing so, don’t forget to keep an eye on your competitors! Monitor their performance and analyze their content that sparks high engagement. This valuable intel allows you to adapt your content strategy on LinkedIn to align with trending industry interests, ensuring your brand stays relevant and at the forefront of the conversation.
How to Grow Your Network on LinkedIn with Dripify
While LinkedIn analytics lets you measure your performance, growing your network is equally important for success on LinkedIn.
Here’s where Dripify sales automation tool comes in handy.
Dripify lets you automate repetitive LinkedIn tasks like visiting profiles, sending connection requests and follow-up messages, endorsing skills, and much more.
- Build your lead pipeline: You can create targeted LinkedIn prospecting campaigns with Dripify. Simply select the automated actions you want, set delays and conditions for maximum efficiency, and watch your leads grow;
- Teamwork: Bring your team on board! Dripify allows seamless collaboration for joint LinkedIn prospecting efforts, ensuring everyone’s on the same page;
- Data-driven decisions: Make informed choices based on advanced analytics. Dripify tracks crucial metrics, conversion rates, and team statistics, providing a clear picture of your prospecting performance;
- Never miss a lead: Respond to leads quickly and efficiently through Dripify’s smart inbox, ensuring you capture every opportunity for connection.
Try Dripify 7-day trial for free (no card required)!

![Email Outreach Tracking [Tips, Tricks and Tools]](https://dripify.io/wp-content/uploads/2025/02/11-7-png.avif)
![Create a Prospecting Plan [+8 Prospecting Methods]](https://dripify.io/wp-content/uploads/2025/02/11-png.avif)
