|
Getting your Trinity Audio player ready...
|
Growing your business requires more than just hard work. To take your company to the next level, you need a strategic plan with specific targets and measurable goals. The number of sales, profit margins, clientele, repeat customers, and so on – there’s quite a complicated yardstick to measure the success of your business.
Some of these indicators are more obvious than others, but tracking the vital ones is essential if you want your business to reach new heights. Whether you’re just starting or have been in business for a while, tracking your key metrics will help you figure out what’s working and what needs improvement.
Are you unsure which performance indicators determine your success and which you should focus on? We hear you! This detailed overview will help you identify critical business metrics to grow your business and devise a better growth plan according to the curated data.
Tracking these right metrics will allow you to decide which direction your company should take next. Let’s not cut to the chase and understand which parameters determine how good (or bad) your business is doing!
What Is KPI?
A Key Performance Indicator (KPI) is a measurable value that demonstrates how effectively a company achieves key business objectives. Typically, KPIs are aligned with a company’s strategic objectives, and you can track their progress over time.
For example, a company aiming to increase sales might track KPIs like revenue, the number of new customers, or customer satisfaction to understand how it is doing. Likewise, an individual worker might track KPIs such as productivity, accuracy, or sales figures to gauge the delivered services. Tracking these KPIs helps companies identify areas of improvement and achieve their goals more effectively.
In the corporate world, KPIs are often used to track progress in areas such as sales, marketing, human resources, and finance. While there are many types of KPIs, they all share one common goal: to help organizations assess and improve their performance.
Some examples of popular KPIs include gross margin, customer satisfaction rate, employee turnover rate, and net promoter score. While each organization has its own goals and targets, KPIs provide a standardized way to measure progress and identify areas for improvement. As such, having a yardstick to measure KPIs is essential for any business that wants to stay competitive in today’s marketplace.
What Are Conversions?
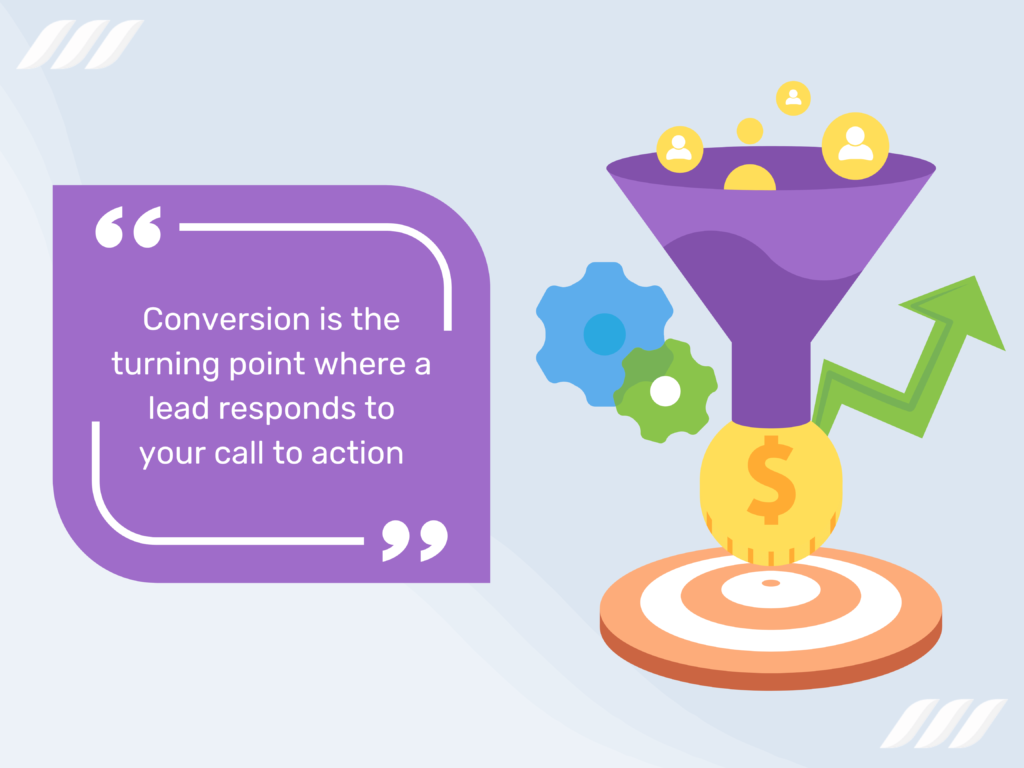
Conversion is the turning point where a lead responds to your call to action. For example, when a prospect converts to a lead and then to a customer in response to your LinkedIn marketing efforts, it represents a conversion.
In the online sphere, a conversion is a metric that tracks how often your website visitors take the desired action, which could be anything from purchasing to signing up for a newsletter. Likewise, for an individual, this conversion might be downloading a white paper, signing up for a newsletter, or registering for an event.
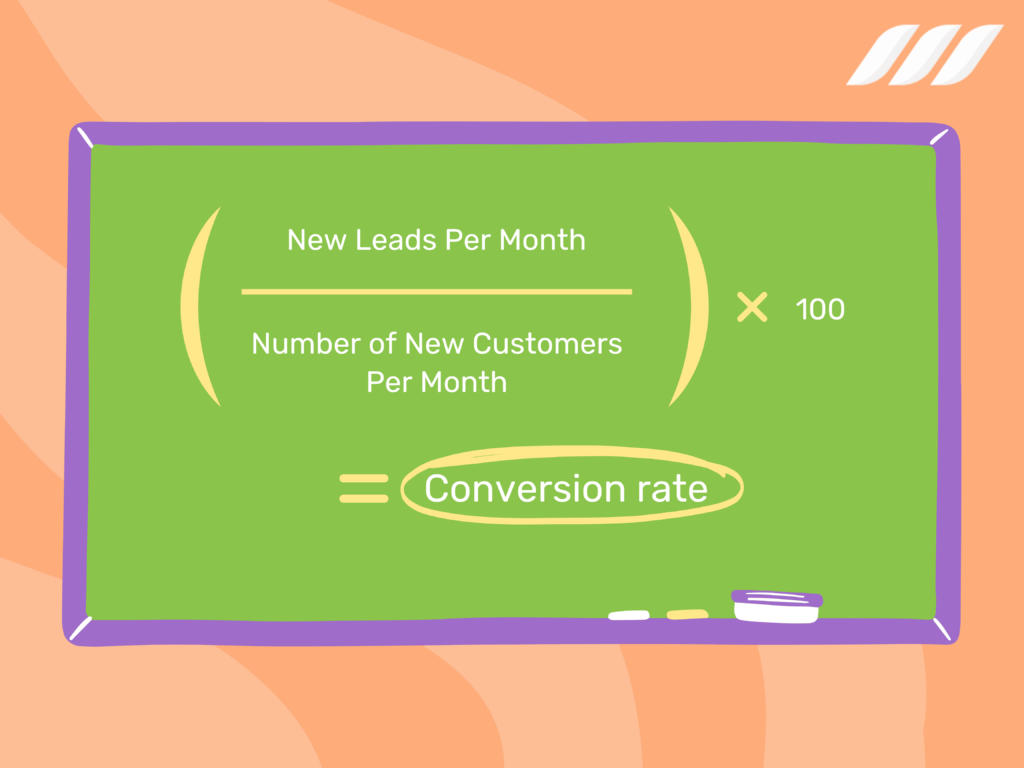
Businesses need website analytics software to set up goals and track progress over time. Knowing your conversion rate allows you to make data-driven decisions about growing your online presence and increasing sales. For example, if a company has a conversion rate of 2%, it means 2% of the people who visit their site signed up for their newsletter or explored their deals.
Conversions are critical in business because they help you understand whether or not your marketing efforts are paying off. Say your conversions are low, and you don’t see many visitors engaging with your preferred content – it indicates that something needs to be changed in your marketing strategy.
The good thing is that you have many ways to increase your conversion rates, like A/B testing, providing incentives, and improving the user experience on your site. If you put the due effort into earning better conversions, it can significantly impact your bottom line.
Automate messaging on LinkedIn and email with Dripify — advanced cloud-based sales automation tool.
Why Are Metrics Important?
At its most basic level, a business exists to make money and to achieve this goal, it needs customers. Without customers, there would be no revenue, and without revenue, there would be no business – therefore, growth is essential for any business. But how do you quantify and achieve this growth? That’s when metrics to grow your business comes into play.
Metrics are benchmarks that provide a detailed look at how your business is performing and where it is headed. Any business can identify opportunities and adapt to the changing variables to keep its growth trajectory on track with these metrics.
There are various growth metrics in the business world, but some of the most important include revenue growth, customer acquisition costs, and customer churn rates. Let’s quickly go over these metrics to build a perspective:
- Revenue growth indicates how much money a business brings in compared to the previous period and shows whether a business is growing or shrinking.
- Customer acquisition costs measure how much it costs to bring in new customers and how efficiently a business is acquiring new customers.
- Customer churn rate measures the percentage of customers who leave a business over a given period and explains how sticky a business’s customer base is.
These are crucial metrics to grow your business because they provide valuable insights into your company’s performance and help you prioritize your efforts accordingly.

11 Metrics to Grow Your Business
As a savvy business owner, you want to measure your company’s success, close loopholes, and supercharge your business growth. Once you’re sure which metrics to track, growing your business becomes a smooth process. It will help you make smarter business decisions and generate more revenue.
Read on for the top metrics to help gauge your business performance.
1. Conversion Rate
B2B sales is a challenging field. Prospecting, qualifying, and lead-management best practices are continuously evolving. And it’s not easy to crack that code when you have so many different companies going after the same customers. That’s why b2b sales is a game of outsmarting your competitors.
To convert leads into paying customers, you need strict processes for qualification and segmentation – but only relevant information that will help you crack the code on who to sell first (and last). The lead conversion rate is that code that can help you gauge your progress, improve your strategies, and make more sales than your competitors.
Conversion rate indicates how many leads become paying clients in response to your marketing efforts. In other words, it measures how many leads you manage to convert into qualified opportunities, which means people who are interested in buying from you, not just taking up your time.
It also represents your sales team’s success at finding the right prospects and converting them into leads and eventually into paying customers. You can also use these insights to determine what keeps your leads from converting into customers.
2. Return on Investment – ROI
Return on Investment or ROI is a crucial metric as it gives you insight into whether your business is achieving its goals and objectives. Say you spend $100 on a marketing campaign and earn $200 in revenue from that campaign; your ROI, in this case, would be 2 (200/100).
A higher ROI means your business is efficient in generating revenue, while a lower ROI indicates the need to reevaluate your investment strategies. In short, ROI is an important metric to ensure that your business operates profitably.
As a business owner, you know that keeping track of your expenses and income is critical to staying profitable. ROI measures how much profit you are making on your investment. Here’s how you calculate it:
Divide your net profit by your total investment. If you have a net profit of $100 and a total investment of $1000, your ROI would be 10%.
With a clear understanding of ROI, you can maximize your profits and ensure the long-term success of your business. ROI is a useful tool for evaluating both short-term and long-term investments. It can help you make intelligent decisions about whether to pursue a particular opportunity or whether to cut your losses and move on.
3. Customer Lifetime Value – LTV
Customer lifetime value (LTV) is a key metric that measures the total value of a customer to a business throughout their relationship. It factors in multiple variables, including repeat purchase rate, customer acquisition costs, and average order value.
Many factors determine this value, including customer churn rate, acquisition costs, and average revenue per customer. For example, let’s say a customer has a value of $1,000. This means that, on average, they will bring $1,000 worth of revenue to your company throughout their relationship with you. Of course, each individual case will be different, but this gives you an idea of how lifetime value can help assess a customer’s potential value.
By understanding LTV, businesses can make strategic decisions about allocating resources to maximize their growth. For example, a business with a high LTV can invest more in customer acquisition than one with a low lifetime value.
Additionally, businesses can use LTV to segment their customer base and target marketing efforts to the most valuable groups. You can find good examples of LTV in businesses that have successfully built long-term customer relationships, such as subscription-based services and membership clubs.
4. Customer Retention and Churn KPI
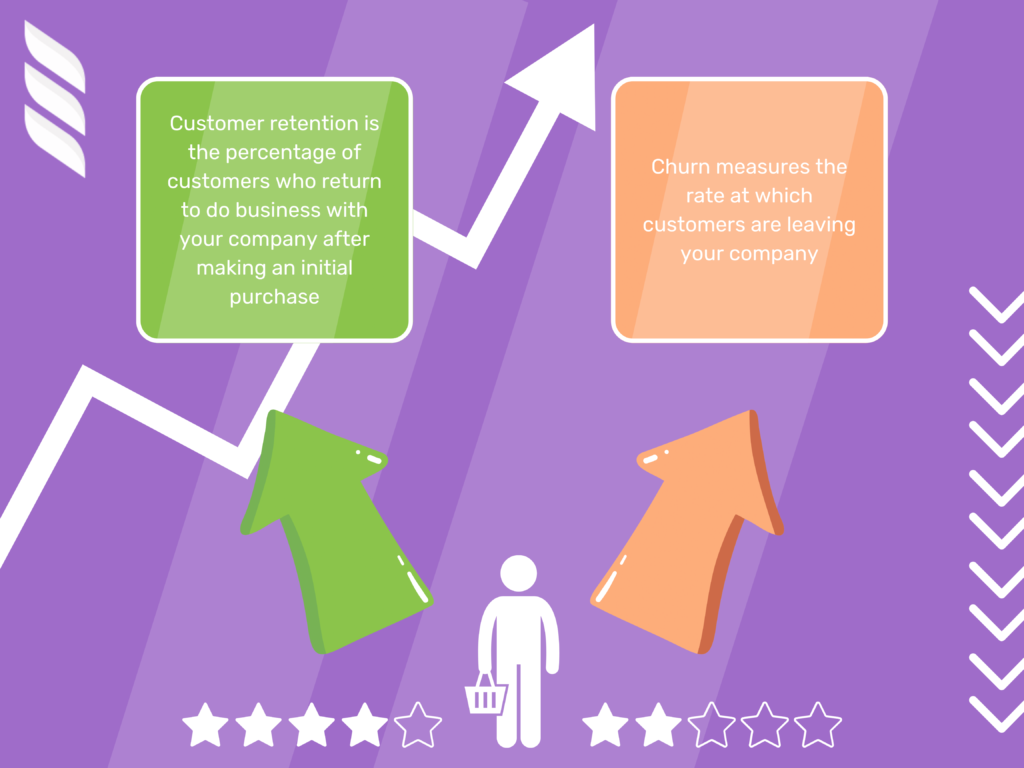
Customer retention is the percentage of customers who return to do business with your company after making an initial purchase. It is a critical metric for your business because acquiring new customers costs more than retaining existing ones.
Your company’s long-term success depends on your ability to keep your existing customers happy, so they return to buy more from you. You can use several ways to improve customer retention, such as offering loyalty rewards, providing excellent customer service, and constantly innovating to stay ahead of the competition.
Similarly, churn measures the rate at which customers are leaving your company. You calculate churn by dividing the number of customers who left during a certain period by the total number of customers you had at the beginning of that period.
If you started the month with 100 customers and had 90 customers at the end of the month, your churn rate would be 10%.
The churn rate will help you understand how well your business is retaining customers because if it’s high, it means you’re losing customers faster than you can replace them, which is not sustainable for your company. On the other hand, a low churn rate indicates that your business is doing a good job of keeping customers happy and engaged – well done!
Like customer retention, you can implement several methods to reduce churn and strengthen your customer base. For example, you may want to offer discounts or loyalty programs to incentivize customers to stick around or provide better customer support to address customer issues.
Ultimately, reducing churn and fortifying your customer retention strategy should be your key goals if you want your business to grow and generate good revenue.
5. Customer Acquisition Cost – CAC
Customer acquisition cost (CAC) is the cost of acquiring new customers for your company. The CAC helps you understand how much you are spending to acquire new customers and whether or not your marketing efforts are resulting in a positive ROI.
For instance, if you spend $100 on marketing and acquire ten new customers, your CAC is $10. This means that for every $1 spent on marketing, you’ll acquire ten new customers. If your business spends $200 on marketing and only acquires 15 new customers, the average CAC rises to $13.33. In this case, your business is not acquiring enough new customers to justify its marketing spending.
If your CAC is high, expanding your customer base and achieving your set growth objectives will be tough. Similarly, when your average CAC is low, you can more easily acquire new customers and grow your business.
Some notable factors that can impact your CAC include marketing and sales expenses, paid advertisement, and the lifetime value of your customers. You may want to continually strive to lower your CAC and keep tabs on your average spending to cut down on extra expenses.

6. Return on Ad Spend – ROAS
Your company’s return on ad spend (ROAS) quantifies the effectiveness of its advertising campaigns. You can measure the ROAS by dividing the revenue generated from your campaigns by the amount spent on them.
A high ROAS means your company’s advertising budget is being used effectively and generating a good investment return. Conversely, a low ROAS means your business can allocate its advertising budget more effectively.
To calculate ROAS, divide the total revenue generated by the campaign by the total cost of the campaign. For example, when you spend $100 on an advertising campaign and generate $1,000 in sales from that campaign, your ROAS would be 10 (1,000/100).
Return on ad spend allows businesses to compare the profitability of different advertising campaigns and choose which ones are most worth their investment.
7. Percentage of Revenue of New vs. Existing Customers
The percentage of revenue from new vs. existing customers is another metric that can quantify your business’s growth. It does so by comparing the revenue generated from new customers to that from existing customers.
If the percentage of revenue from new customers increases, it indicates that your business is growing and reaching new customer strata. But if the revenue from new customers is decreasing, know that your business is not growing.
For example, if your company has 100 new customers and generates $10,000 in total revenue, then $1,000 of that revenue comes from new customers. The remaining $9,000 comes from your existing customers. This percentage of revenue from new customers can be a valuable metric for evaluating a company’s growth because it provides insight into how effective it is at acquiring new customers.
Similarly, if your existing customers are amongst the top buyers, you’re good at retaining customers and acquiring their loyalty. Although a loyal customer base is great for your business, you cannot rely on it forever. Therefore, if you find that most of your sales are from new customers and one-time buyers, you must invest more resources in retaining customers.
8. Website Traffic
Today’s websites are more than just pages of information. They’re dynamic portals that drive users to take action by completing a transaction, signing up for a newsletter, or any number of other actions your site prompts them to complete.
And while there’s no one right way to measure the performance of your website, there are several tools and techniques you can use to monitor its performance and identify areas where you can improve user experience. After all, the goal of every website is to drive measurable results.
Website traffic measures the number of visitors to a website by giving insight into how well your website is performing. Many factors can affect your site traffic, such as the website’s content, design, speed, and ease of navigation.
A high traffic level indicates that your site is doing well and is popular among users – something every business needs. Conversely, low traffic levels suggest that a website is not performing as well as it should and that your marketing efforts aren’t paying off well.
Here’s why your site traffic can affect your business success:
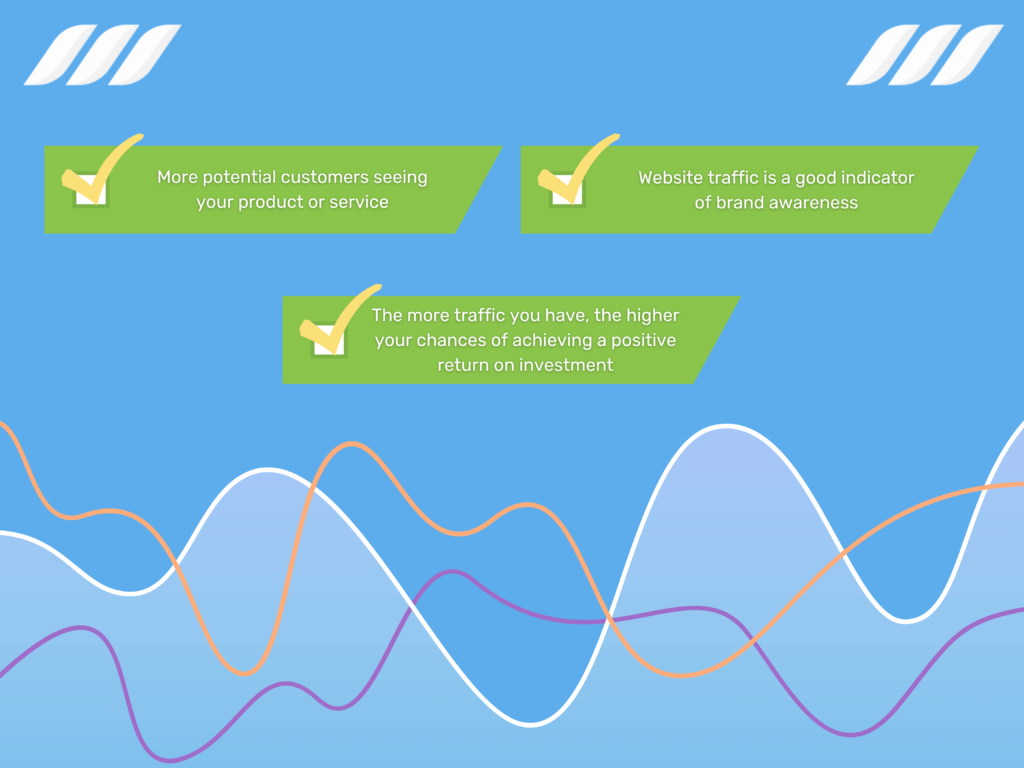
- More website traffic generally leads to more conversions because you have more potential customers seeing your product or service.
- Website traffic is also a good indicator of brand awareness – the more people visiting your website, the more likely they will be aware of your brand.
- Site traffic also affects your bottom line because the more traffic you have, the higher your chances of achieving a positive return on investment.
All of these factors make website traffic one of the top metrics to grow your business and need due effort on your part. If your website or content isn’t compelling and attractive enough, it won’t engage and retain customers, eventually increasing your churn rate.
You’ll need one or more website analytics tools to keep track of your website traffic. The best web analytics tools include Google Analytics, Adobe Analytics, Matomo, and Clicky.
9. Sales revenue
Sales revenue is the total amount of money a company brings in from its sales, typically the top-line item on a company’s income statement.
For companies that sell physical products, sales revenue includes the cost of the goods sold, plus any shipping and handling charges.
Likewise, for companies that provide services, sales revenue is the income generated from its services. Sales revenue is vital to track because it indicates how well the business performs. If your sales revenue increases, your business is performing well.
- Sales Revenue = Number of Sales x Price Per Sale
So, if a business makes 100 in sales for $5 per sale, the sales revenue, in this case, is $500. If it made 50 sales for $10 per sale, the sales revenue is $500. And so on.
By tracking sales revenue, businesses can ensure they are on track to reach their financial goals. Careful curated sales data can help you identify new trends and make strategic product development and marketing decisions.
By tracking your sales revenue, you’ll ensure that they are moving in the right direction and position your business for long-term success. Also, you should understand that several factors can affect sales revenue, such as the price of products, the number of products sold, and the mix of products sold – so collectively controlling them isn’t straightforward.
10. Net Profit Margin
Your net profit margin tells you what percentage of your revenue is left after all your business expenses are paid. The higher your net profit margin, the more profitable your business is. And to grow your business further, you need to increase your revenue and decrease your expenses.
For example, you could increase your revenue by selling more products or services or decrease expenses by finding cheaper suppliers and reducing overhead costs. Either way, increasing your net profit margin will help you grow your business.
- Net profit margin = (net income / total revenue) x 100
You can use this equation to calculate the net profit margin for your business. Here, your net income is the total revenue of the business minus the expenses incurred during that period. The net profit margin tells you what percentage of each dollar of revenue your business keeps as profit.
A higher net profit margin indicates that your company is more efficient and is generating more profit per dollar of sales. For example, if your net profit margin is 10%, this means that for every $100 in sales, your company earns $10 in profit.
If you wish to grow your business, increase your sales while maintaining or increasing your net profit margin. Here are a few ways to do this: focus on selling higher-margin products, reducing costs, or increasing prices. In the end, carefully managing your net profit margin will ensure your business continues growing and thriving.
11. Gross Margin
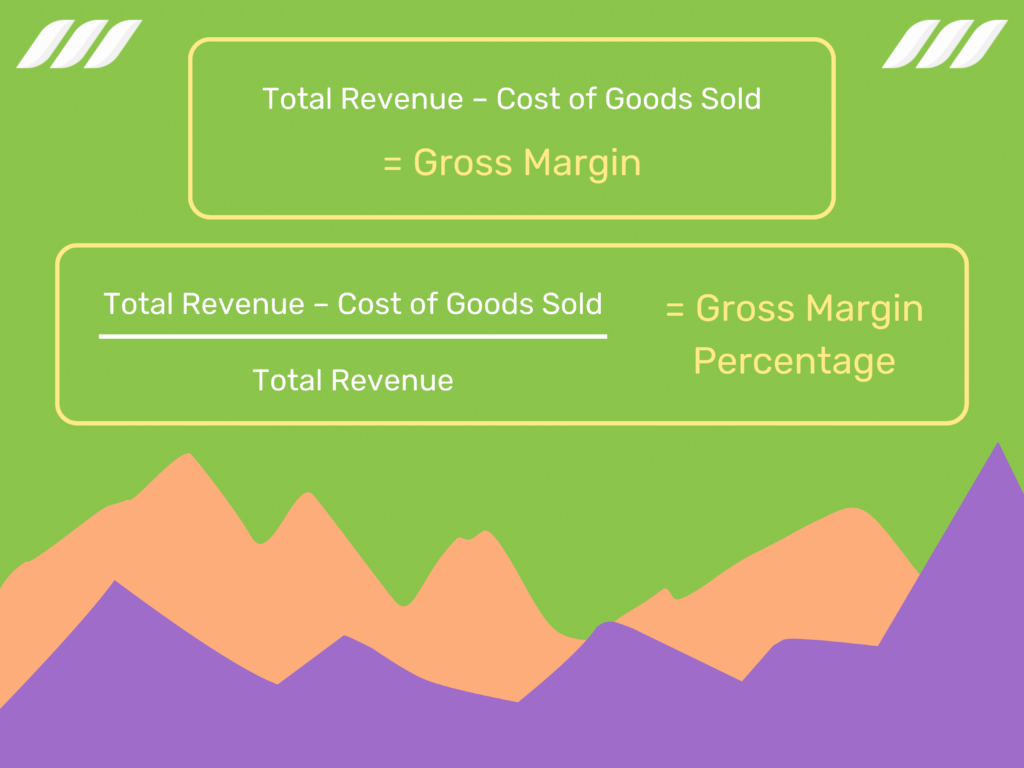
Your gross margin is the difference between your revenue and your cost of goods sold. This metric is typically expressed as a percentage. For example, if your revenue is $100 and your cost of goods sold is $80, your gross margin would be 20%.
Gross margin is an important business metric because it indicates how well you manage your costs. You can easily estimate the gross margin for your business by subtracting the cost of goods sold from the total revenue. This number can be expressed as a percentage by dividing it by the total revenue.
- Gross Margin = Total Revenue – Cost of Goods Sold
To express this as a percentage, we would divide it by the total revenue:
- Gross Margin Percentage = (Total Revenue – Cost of Goods Sold) / Total Revenue
This number represents a company’s profit on each sale after accounting for the cost of the goods sold. A higher gross margin percentage means a company makes more profit on each sale.
If your gross margin is too low, it could mean you are not pricing your products correctly. It could also indicate that you’re not efficiently managing your production costs. On the other hand, if your gross margin is too high, it could indicate that you have room to lower your prices or that you could invest more in marketing and product development.
Keeping track of your gross margin can help you ensure that you are making enough profit to sustain and grow your business.
Conclusion
As the old saying goes, “you can’t improve what you don’t measure,” and this is especially true when it comes to business growth. To ensure that your business is on the right track, it’s important to track key metrics that will give you insight into your progress. Some of the most important metrics to track include sales figures, customer acquisition costs, and churn rate.
Here’s a quick sum-up of these points before we sign off:
- Your gross profit margin measures the percentage of revenue that is left after accounting for the cost of goods sold. This metric can be a helpful indicator of how efficiently your business is operating.
- Your business’s customer churn rate quantifies the percentage of customers who stop doing business with your company over a given period. A high churn rate can indicate that your business is not providing value to its customers.
- Lastly, your gross profit per customer measures the average amount of money each customer spends with your business. Your gross margin can help assess the overall health of your customer base.
Closely monitoring these key metrics to grow your business will help you make informed decisions about allocating resources and driving growth. By taking a data-driven approach to business growth, you can put yourself in a strong position to succeed in today’s competitive marketplace. Good luck with your ventures!
![How to Write a Price Increase Letter [Tips, Examples, and Free Template]](https://dripify.io/wp-content/uploads/2021/12/27.png)
![How to Write an Effective Collaboration Email [+Templates]](https://dripify.io/wp-content/uploads/2023/05/13.png)